
By Alex Nowrasteh and Andrew Forrester
T he assimilation and integration of immigrants and their children into American society is vital to the future success of the United States of America. Learning English and adopting American social values are important components of assimilation and integration into our society, but patriotism and confidence in American institutions are also critical. Despite the importance of this issue, there is relatively little research on how well immigrants and their children patriotically assimilate.
Based on their responses to the General Social Survey, we found that immigrants and their children have levels of patriotism that are about the same as those of nativeborn Americans or that exceed them. Additionally, immigrants and their descendants have more trust in the three branches of American government than do native-born Americans. Immigrants bolster patriotism and national trust in American government institutions.
John Fonte, director of the Center for American Common Culture at the Hudson Institute, defines patriotic assimilation as “when a newcomer essentially adopts American civic values and the American heritage as his or her own. It occurs, for example, when newcomers and their children begin to think of American history as ‘our’ history not ‘their’ history.” Fonte and others are worried that current immigrants and their children are not patriotically assimilating as well as previous generations. Unfortunately, there is little recent empirical research on this question. Many other research papers that focus on American identity do not report answers to questions about patriotism or opinions regarding the United States and its place in the world.
To help fill this gap, Fonte and Althea Nagai of the Hudson Institute analyzed the 2007 Harris Interactive online poll results and found that “native-born citizens are much more patriotically attached to America than immigrant citizens and the native-born are much better informed about American history and government than naturalized citizens. This analysis suggests to us that Americanization or patriotic integration is not working as well as it should today.”
There is also scant empirical research in peer-reviewed academic journals about immigrant patriotism. Jack Citrin, a political science professor from the University of California, Berkeley and several coauthors concluded from the results of multiple surveys that “blacks and non-citizen Hispanics express slightly less patriotism than whites,” and that “after adjusting for differences in age and education native-born Hispanics actually evidenced higher levels of patriotism.”6 Roger Waldinger and Lauren Duquette-Rury analyzed the Latino Immigrant National Election Study and found that patriotism and trust in the US government increase over time for Hispanic immigrants, largely because they compare this country to their home countries. As one interviewee said, “If the Mexican government was good, we wouldn’t be here.”
Methodology and Data
This analysis is based on responses from the nationwide biennial General Social Survey (GSS) conducted by the National Opinion Research Center at the University of Chicago. The GSS data allow us to directly measure the opinions of immigrants and native-born Americans.8 We compared responses to questions about patriotism, love of country, and confidence in American government institutions from native-born Americans to immigrants for the years 2006 to 2016. Many of the responses are pooled from the entire decade, while others are available for only the year 2014, based on when the GSS asked specific questions. The second generation are the US-born children of immigrants, the third generation are the native-born grandchildren of immigrants, and the fourth generation includes those who are the great-grandchildren of immigrants and who have even more distant immigrant relatives. The category of “all natives” combined the second, third, and fourth generations into one group. This brief displays them in tables below each figure. We adjusted weights based on the number of adult respondents for all years.
Several of the responses to GSS survey questions had more answers than are displayed in the following figures and tables. To present the findings more clearly, some of the responses are combined into larger response categories that preserve the meaning while sacrificing unnecessary complexity. For example, the responses for Figure 1 and Table 1 were strongly agree, agree, neither agree nor disagree, disagree, and strongly disagree. This brief combined them into the broader categories of agree, neither, and disagree for figures and tables 1, 3, 5, and 6.
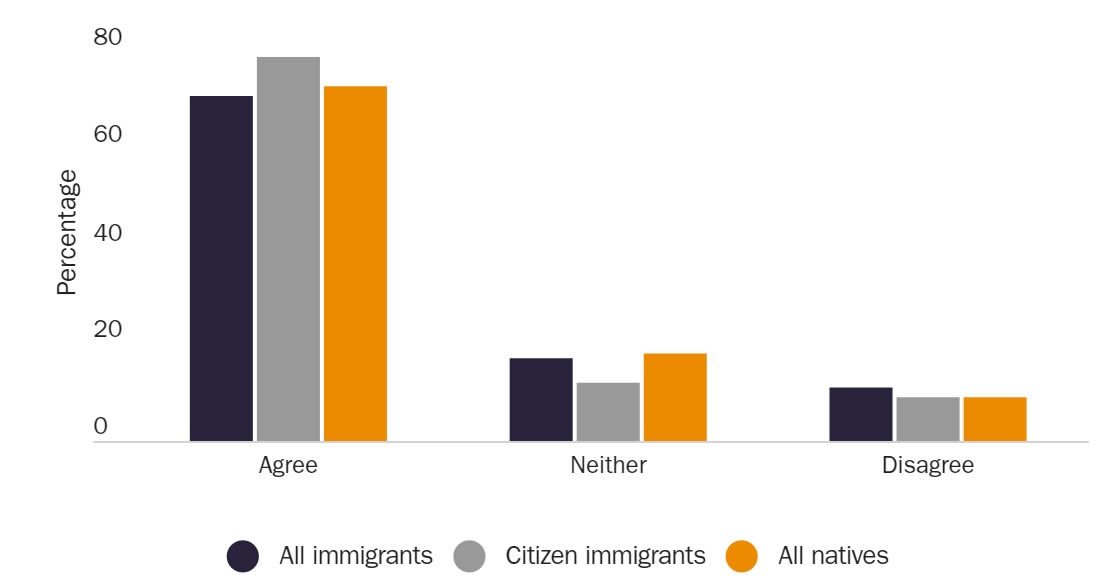
Figure 1: America is better than most other countries
 Note: Years covered by this survey question: 2014.
Source: Authors’ analysis of the General Social Survey data, National Opinion Research Center at the University of Chicago.
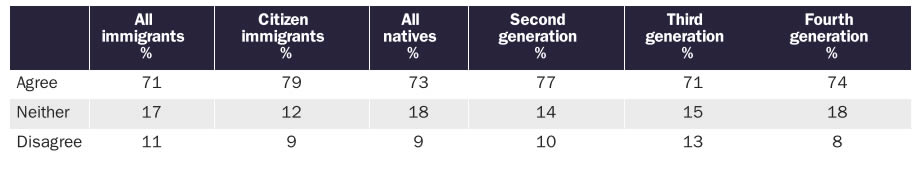
Table 1: America is better than most other countries by generation
Note: Years covered by this survey question: 2014.
Source: Authors’ analysis of the General Social Survey data, National Opinion Research Center at the University of Chicago.
Lastly, we used an ordered logit model to estimate the probability that immigrant responses to the GSS questions are different from the responses of native-born Americans to a statistically significant extent. We regressed each survey question on both an indicator variable equal to one for immigrants and an interaction term for whether an immigrant is a naturalized citizen. For each question below, we indicate whether the immigrant responses are different from those of natives to a statistically significant degree. The output tables are in the appendix and report average marginal effects.
Patriotic Assimilation
Patriotism is difficult to measure. A hypothetical survey question that asked, “How patriotic are you?” would not be reliable because social desirability bias, a common tendency whereby respondents answer survey questions in a way that will be viewed favorably by others rather than honestly, would exaggerate the degree of patriotism among Americans and immigrants. Fortunately, the GSS asks respondents about the United States’ relative position in the world, pride in American history, and opinions about other aspects of American national identity. Responses to these questions should be closely correlated with feelings of true patriotism, love of country, and the adoption of American civic values and heritage.
Figure 1 shows responses to the question, “How much do you agree or disagree with the following statement? Generally speaking, America is a better country than most other countries.” Seventy-one percent of all immigrants agree with this statement compared to 73 percent of native-born Americans. Immigrants who are American citizens are even more likely to agree with the statement that America is better than most other countries than are native-born Americans, 79 percent to 73 percent. Eleven percent of all immigrants disagree with the statement, while only 9 percent each of citizen immigrants and natives disagree. Statistically, we find no evidence to suggest that immigrants are more or less likely to respond to the questions differently from natives (Table A1). Table 1 shows the responses to this question by generation of native-born Americans. Seventy-seven percent of the second generation agree that America is better than most other countries, a percentage greater than the third and fourth generations.
Figure 2 shows responses to the question, “How proud are you of being American?” Unlike other figures in this brief, Figure 2 excludes the responses for all immigrants because a large percentage of them are not American citizens. Seventy-five percent of immigrants who are American citizens are very proud to be American compared to only 69 percent of native-born Americans. The two groups of respondents are just as likely to say that they are not very proud of being American. The responses of citizen immigrants are not different to a statistically significant extent relative to native-born Americans (Table A1). Table 2 shows that 77 percent of the second generation are very proud of being American, meaning that they have more pride in their nationality than any other generation.
Figure 2: Proud of being American
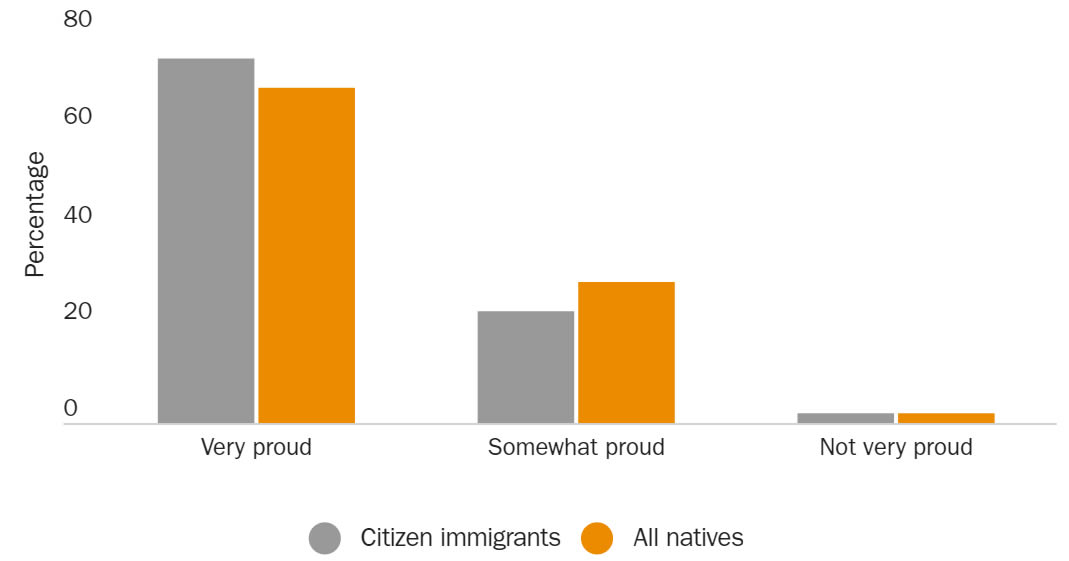
Table 2: Proud of being American by generation
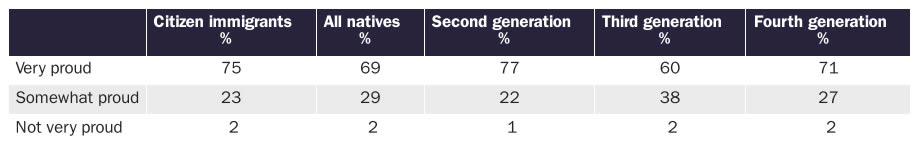
Figure 3 asks respondents to agree or disagree with this statement: “I am often less proud of America than I would like to be.” In contrast to figures 1 and 2, those who agree with the statement here are less patriotic and those who disagree are more patriotic. Thirty-two percent of all immigrants and 33 percent of citizen immigrants agree with the statement compared to 37 percent of native-born Americans. Forty percent of all immigrants disagree with the statement that they are “often less proud of America,” slightly below the 42 percent of native-born Americans. Fifty-three percent of immigrants who are American citizens disagree. The responses of all immigrants and natives are not different to a statistically significant extent. Table 3 shows that the second generation are the least likely to be “less proud of America.” As a twist, they are also the most likely to answer “neither” and the least likely to disagree.
Figure 3: Less proud of America
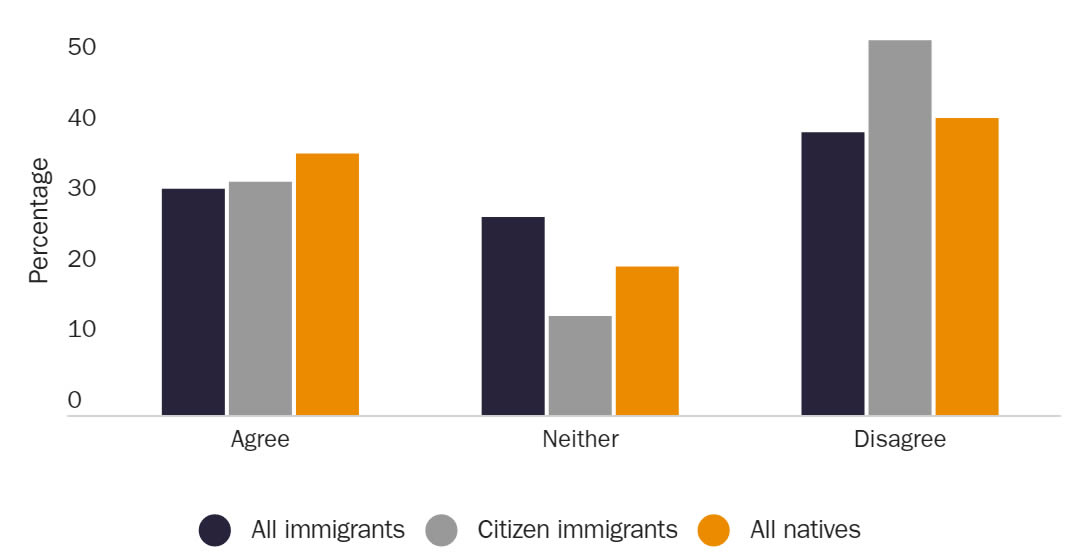
Table 3: Less proud of America by generation
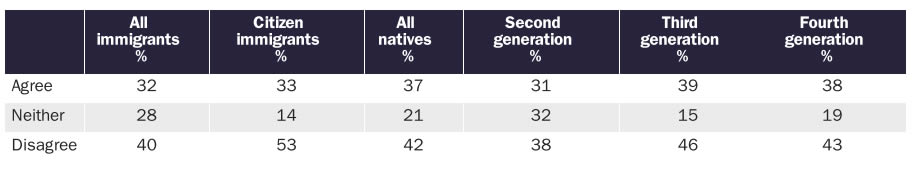
Figure 4 shows responses to the question, “How proud are you of America in each of the following? Its fair and equal treatment of all groups in society.” All immigrants are proudest of fair and equal treatment, with 23 percent of them saying they are very proud and 48 percent saying they are somewhat proud. Twenty-two percent of citizen immigrants say they are very proud and 42 percent say they are proud. Native-born Americans are the least proud of how America treats groups equally. Immigrant pride in how America treats groups equally is higher than that of native-born Americans.
This is reflected by immigrants being significantly more likely to answer “very proud” and “somewhat proud” than natives (Table A2). Table 4 shows that members of the second generation are more likely to be very proud and less likely to be somewhat proud than respondents in the third and fourth generations. If the percentages in Table 4 were grouped into broader response categories of proud or not proud, then the second, third, and fourth generations would have about the same responses. Immigrant responses here imply that most of them also think that their own group is treated fairly and equally.
Figure 4: Proud that America treats groups equally
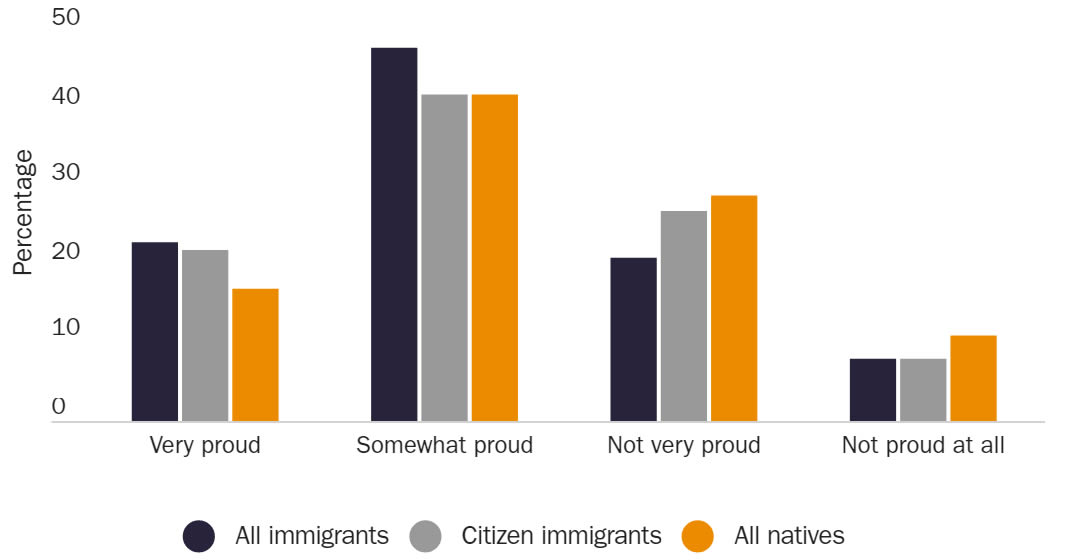
Table 4: Proud that America treats groups equally by generation
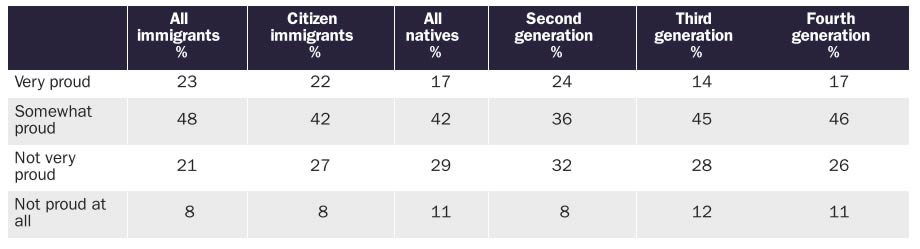
Figure 5 includes responses to the question, “How much do you agree or disagree with the following statements? There are some things about America today that make me feel ashamed of America.” Those who agree with the statement are less likely to be patriotic than those who disagree with it. All immigrants and citizen immigrants are less likely to be ashamed of the United States than are native-born Americans. To a statistically significant degree, immigrants are less likely to be ashamed of some aspects of America and more likely to neither agree nor disagree or disagree (Table A1). Table 5 shows the results by generation. The second generation are the least likely to agree that they are ashamed of some aspects of America relative to every native-born generation and the most likely to not feel ashamed.
Figure 5: Ashamed of some aspects of America
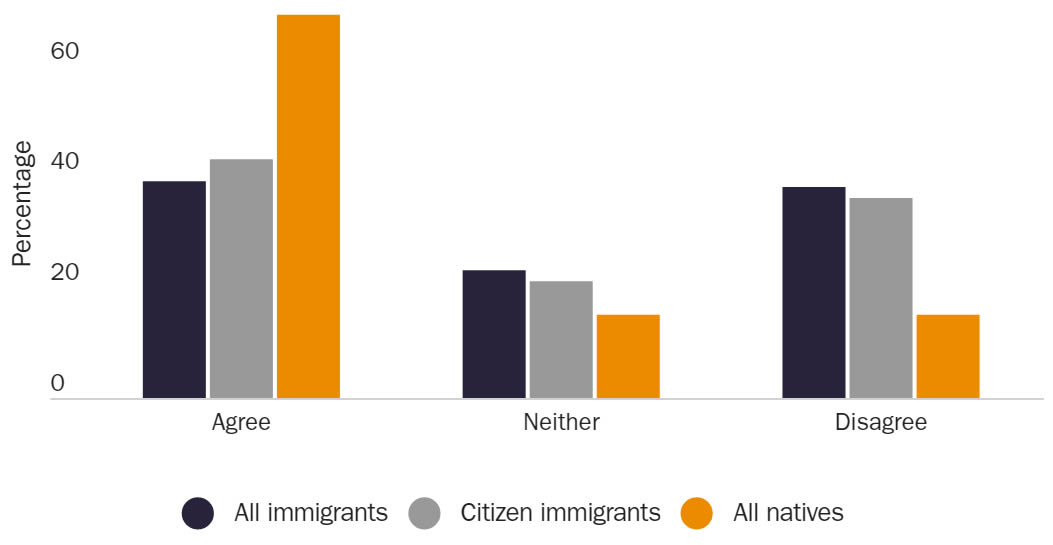
Table 5: Ashamed of some aspects of America by generation
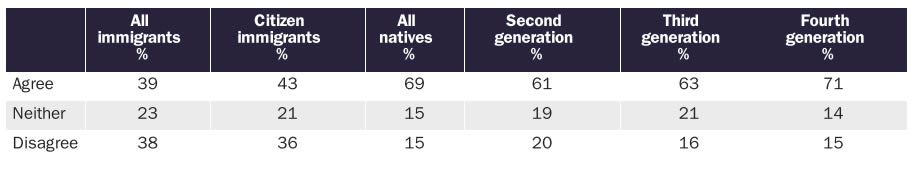
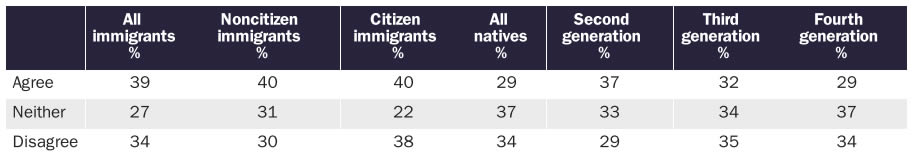
Figure 6 includes responses to the question, “How much do you agree or disagree with the following statement? The world would be a better place if people from other countries were more like the Americans.” This is just a general question that is correlated with how much the respondent likes Americans relative to foreigners. Thirty-nine percent of all immigrants and 40 percent of immigrant citizens agree that the world would be better if people from other countries were more like Americans. All immigrants are as likely as natives to disagree with the statement, while citizen immigrants are slightly more likely to disagree. However, there are no statistically significant differences between the responses of native-born Americans and all immigrants to this question. Table 6 shows that the second generation is more likely to say that “the world would be better if people from other countries were more like Americans” than any other generation of native-born Americans, as well as less likely to say the opposite.
Figure 6: The world would be better if people from other countries were more like Americans
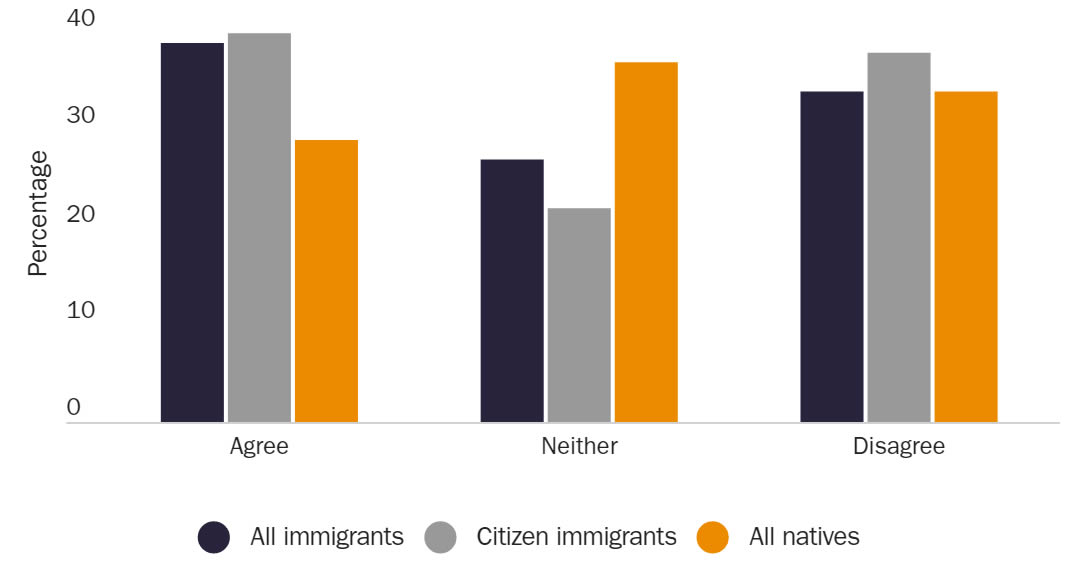
Table 6: The world would be better if people were more like Americans by generation
There are at least three possible explanations for why immigrants are as patriotic or more patriotic than native-born Americans and why their love for this country is passed to the second generation. The first is that immigrants are more patriotic because they chose to become Americans. All things being equal, we should expect those who choose to become Americans to like America more than do those of us who were born here. Their children also understand that choice, which potentially explains their patriotic opinions. The second is that immigrants and their children have memories of how bad other countries are, so they are more appreciative of the United States and thus more patriotic. The third explanation, related to the second, is that disillusionment with the United States takes generations to set in, so only those whose ancestors settled here several generations ago are knowledgeable enough to be less patriotic. Regardless of the possible explanations, immigrants and their children are at least as patriotic as native-born Americans and frequently more so.
Confidence in American Institutions
Immigrants have more confidence in the three branches of our federal government than do native-born Americans. This does not imply that immigrants want a larger, more powerful government. The responses in figures 7, 8, and 9 are to the question: “I am going to name some institutions in this country. As far as the people running these institutions are concerned, would you say you have a great deal of confidence, only some confidence, or hardly any confidence at all in them?” Figure 7 shows that immigrants are more confident in Congress, often by significant margins and regardless of citizenship status. Figure 8 shows that immigrants are more confident in the presidency than native-born Americans, with almost no difference between immigrants by citizenship status. Figure 9 shows that immigrants have more confidence in the Supreme Court than native-born Americans, but by smaller margins than in figures 7 or 8.
Figure 7: Confidence in Congress
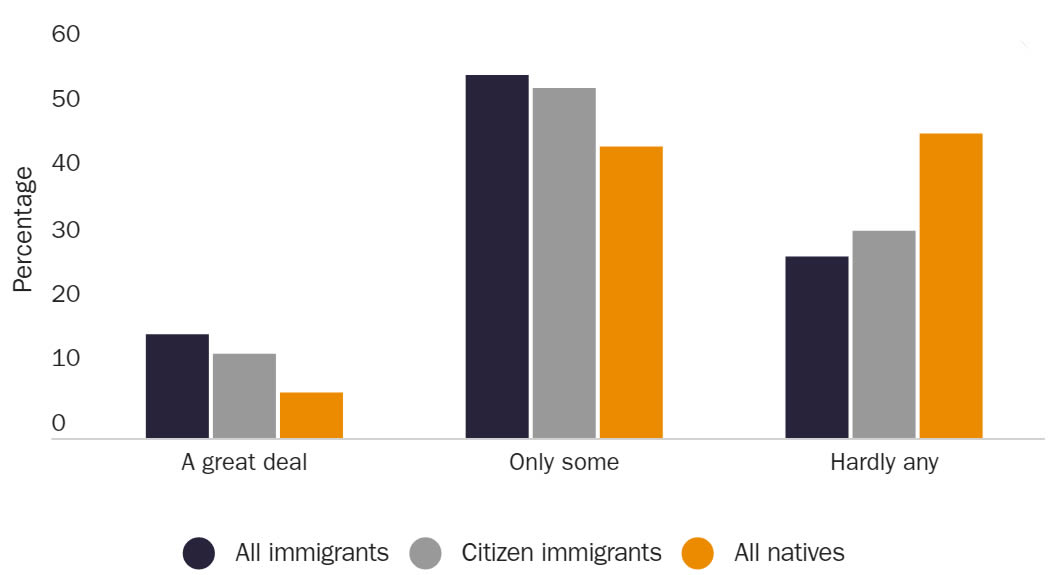
Figure 8: Confidence in the presidency
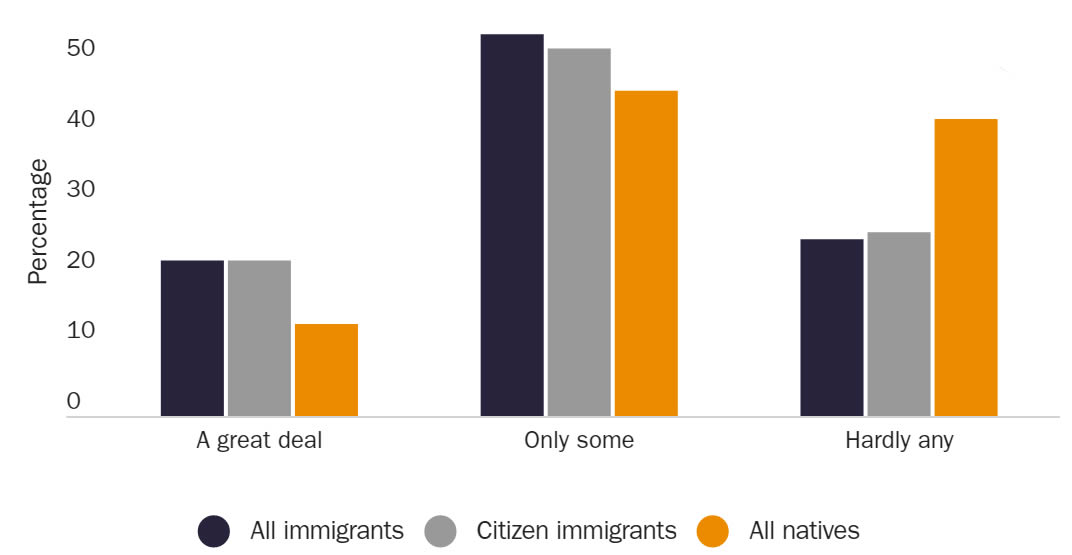
Figure 9: Confidence in the US Supreme Court
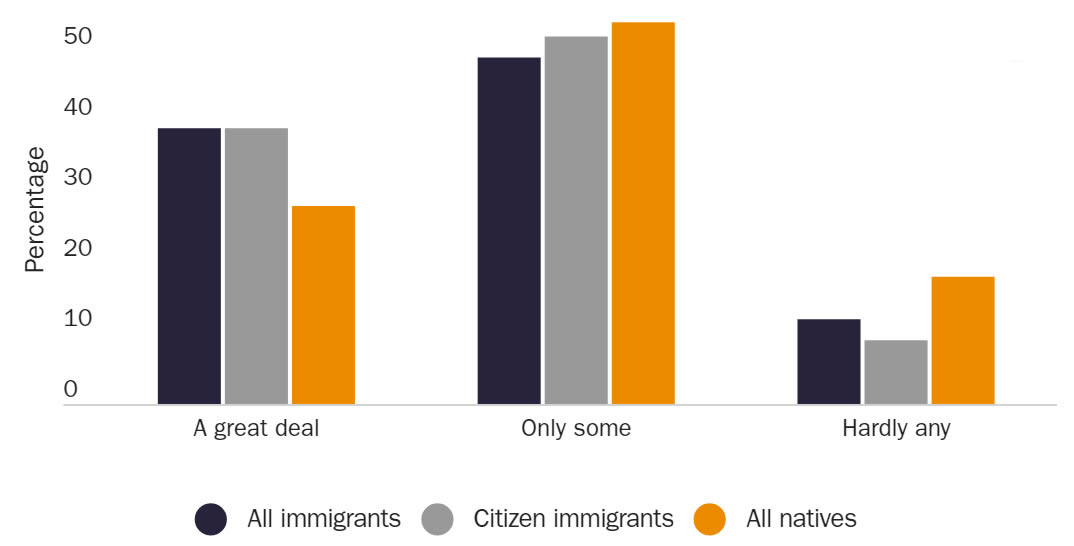
To a statistically significant extent, all immigrants are more likely to have a great deal of confidence in Congress, the presidency, and the Supreme Court than are native-born Americans (Table A3). Immigrants are also more likely to have only some confidence in Congress and the presidency, to a statistically significant extent, relative to natives. However, immigrants are less likely, to a statistically significant extent, to have confidence in the Supreme Court relative to natives-although the difference is the smallest of any coefficient reported. Immigrants are also less likely to have hardly any confidence in all three branches of government, relative to natives, to a statistically significant extent.
Tables 7, 8, and 9 show that second-generation respondents are more likely to have confidence in the three branches of American government than any other generation of native-born Americans. Confidence in the institutions of the American government fades somewhat in the second generation relative to their immigrant parents, as is only natural considering how these three branches actually operate, but their confidence still surpasses that of other natives.
Table 7: Confidence in Congress by generation
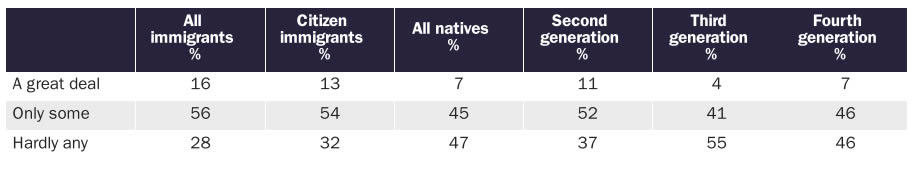
Table 8: Confidence in the presidency by generation
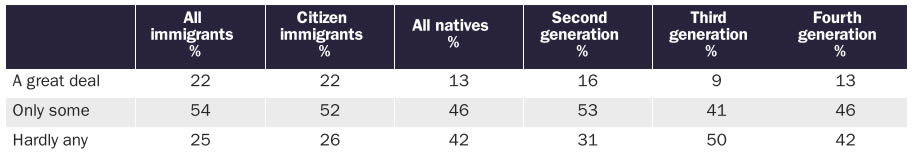
Table 9: Confidence in the US Supreme Court by generation

There are at least two possible explanations for the greater immigrant trust in the three branches of the federal government. The optimistic explanation is that immigrants appreciate how well the US government functions because they remember that their home governments were quite bad.10 The cynical explanation is that immigrants and their children have not had enough experience to realize how poorly these American branches of government function and hence it takes several generations of distance from the governments that their ancestors lived under to lose that perspective.
Conclusion
Many conservatives are worried that immigrants and their children are not as patriotic as native-born Americans. They should rest assured because the responses from immigrants and their children to the above survey questions reveal a degree of patriotism that is nearly identical to that of native-born Americans or, in many cases, exceeds it to a statistically significant extent. Similarly, immigrant and second-generation confidence in our political institutions exceeds that of native-born Americans. Far from being broken, America’s patriotic assimilation system is thriving, and immigrants are boosting overall American confidence in our institutions of government.